Mark Skidmore* and Catherine Austin Fitts** (with Rob Kirby*** and David Pare****)
August 3, 2020
PDF Copy Available Here.
Related Documents:
In May 2020, we provided an update (Skidmore and Fitts, 2020,) regarding the $21 trillion in unsupported journal voucher adjustments documented in federal government reports created by the Office of the Inspector General. In that update, we discussed new information obtained via a Freedom of Information Act (FOIA) request in which we received documentation regarding 170 unsupported adjustments that tallied to $2.1 trillion. We also presented new information regarding a very high rate of redemption and reissuance of federal government debt instruments. In 2019, total government debt was about $22 trillion, but bond redemptions and reissuance were about $95 trillion (United States Department of Treasury, 2020a). Further, redemptions and reissuance had grown at a much faster pace than debt over the 2001-2019 period and appeared to be much larger than what seemed to be required to support the existing debt outstanding. This information prompted us to ask whether high redemptions and reissuance were indicative to more debt outstanding than is officially reported. In June 2020, Mark Skidmore gave an interview on USA Watchdog in which he discussed this new information and invited others to offer ideas and suggestions. Fortunately, several suggestions emerged, one of which was to examine internally held debt. Recall that the federal government issues General Account Series securities for funds such as the Federal Old-Age and Survivors Fund, which are held internally within the government. Currently, internal debt outstanding is more than $6 trillion. In this update, we offer new analyses regarding the nature of the large redemptions and reissuance being used to support internally held debt. Specifically, a portion of the internally held debt is composed of securities with one-day maturities. One-day securities require turnover every business day, thus generating very large redemptions and reissuance over the course of a year.
Internally held debt is managed by the United States Department of Treasury. Typically, this debt is held as special Government Account Series (GAS) securities. GAS securities come in varied maturity lengths, ranging from one-day up to 10 or more years. The Treasury Direct website (United States Department of Treasury, 2020b) contains daily fund balances for more than 700 funds managed by Treasury, dating back to 2001. While several funds have substantial one-day security holdings, the Thrift Savings Fund (account 026×6153) is an outlier.
The Thrift Savings Plan is a savings vehicle for federal government employees that has many of the same features of a typical 401k plan. Information about the Thrift Savings Plan can be found at Wikipedia (Wikipedia, 2020a) and at the federal government’s Thrift Savings Plan website (Thrift Savings Plan, 2020). There are five funds available in the Thrift Savings portfolio; the G, F, C, S and I funds. The F, C, S and I funds are all “indexed” funds, the management of which is outsourced to BlackRock. According to the information provided by Wikipedia, one of the key features of indexed funds is that a “lack of active management generally gives the advantage of lower fees and, in taxable accounts, lower taxes.” These statements indicate that the Thrift Savings Fund uses a passive management strategy. Wikipedia (Wikipedia, 2020b) offers a concise description of a passive management strategy:
The most popular method is to mimic the performance of an externally specified index by buying an index fund. By tracking an index, an investment portfolio typically gets good diversification, low turnover (good for keeping down internal transaction costs), and low management fees. … One of the largest equity mutual funds, the Vanguard 500, is passively managed. The two firms with the largest amounts of money under management, BlackRock and State Street, primarily engage in passive management strategies.
This background information will be useful in our evaluation of the G Fund. The 2018 Thrift Savings Plan Financial Statement is available at the Federal Retirement Thrift Investment Board website (FRTIB, 2020). As outlined in the financial statement, in 2018 the total amount managed was $559 billion, which is allocated to five funds:
Table 1: Thrift Savings Plan Fund Allocations from the 2018 Financial Statement
| Fund | Manager | Amount in 2018 |
|---|---|---|
| U.S. Government Securities Investment Account | U.S. Treasury | $253 billion |
| TSP F Fund – U.S. Debt Index Account | BlackRock | $ 28 billion |
| TSP C Fund—Equity Index Account | BlackRock | $177 billion |
| TSP S Fund—Extended Equity Index Account | BlackRock | $ 60 billion |
| TSP I Fund EAFE Equity Index Account | BlackRock | $ 41 billion |
| Total Assets | $559 billion |
It is not unusual for 45% of a retirement portfolio to be allocated to government securities. However, there is something unusual here in that the G Fund is entirely composed of securities with one-day maturities. Every day, Treasury redeems and reissues the entire balance of the G Fund. According Wikipedia (Wikipedia, 2020a), the G Fund is defined as:
G Fund –Government Securities fund. These are unique government securities specifically issued to the TSP (thus, not available to the general public) and earn interest set by law at the weighted average yield on outstanding US Treasury securities with four or more years to maturity. Since these securities are backed by the full faith and credit of the US Government; the G Fund is the only fund with no risk of loss of principal. The G Fund was the initial fund established by the TSP when it began operations on April 1, 1987.
By law, the G Fund must generate a return that is equal to the “weighted average yield on outstanding US Treasury securities with four or more years to maturity”. The web archive provides more information about the G Fund (Thrift Savings Plan, 2010). The fund description indicates that it invests in “short-term securities” but offers the return of longer-term securities. This is possible because the securities are non-marketable, and thus government sets the rate of return on a monthly basis. The fund reports a much higher return for TSP investors relative to overnight borrowing rates in the marketplace. For reference, the Federal Reserve Bank of New York (Federal Reserve Bank of New York, 2020) reports that overnight borrowing at the time this report was written had an interest rate of about 9 basis points.
It was surprising to learn that all $253 billion in the G Fund is entirely held in securities with one-day maturities. Because the Treasury “redeems” and “reissues” these securities every day, this fund alone generated about $44 trillion in redemptions and reissuance in 2019. This single fund is responsible for nearly half of the $94 trillion in total redemptions reported by the Treasury in 2019.
Thanks to the assistance of technical consultant Mr. David Pare, Python code was used to download the daily G Fund balances for every day dating back to 2001 from the Treasury Direct website (United States Department of Treasury, 2020b). From these data, we calculated the average daily fund balances by year, as well as the required turnover (redemptions and issuance) by year over the 2001—2019 period.2 This information is summarized in Tables 2 and 3 below. Figures 1 and 2 depict this information in graphical form.
Table 2: Thrift Savings Fund G Fund Average Daily Balance ($ billions): 2001-2019
| Year | Mean | Median | Std. Dev. | Minimum | Maximum |
|---|---|---|---|---|---|
| 2001 | 36 | 36 | 2 | 33 | 39 |
| 2002 | 39 | 42 | 9 | 5 | 47 |
| 2003 | 41 | 50 | 17 | 0 | 51 |
| 2004 | 51 | 54 | 10 | 0 | 57 |
| 2005 | 61 | 62 | 2 | 57 | 64 |
| 2006 | 66 | 70 | 12 | 6 | 73 |
| 2007 | 78 | 78 | 3 | 73 | 84 |
| 2008 | 96 | 95 | 7 | 84 | 108 |
| 2009 | 112 | 113 | 7 | 0 | 115 |
| 2010 | 120 | 120 | 3 | 115 | 125 |
| 2011 | 119 | 129 | 36 | 0 | 148 |
| 2012 | 149 | 151 | 7 | 110 | 159 |
| 2013 | 132 | 156 | 48 | 0 | 178 |
| 2014 | 179 | 179 | 10 | 105 | 191 |
| 2015 | 116 | 112 | 75 | 0 | 209 |
| 2016 | 217 | 217 | 5 | 207 | 228 |
| 2017 | 144 | 182 | 80 | 13 | 226 |
| 2018 | 219 | 238 | 57 | 29 | 253 |
| 2019 | 174 | 241 | 91 | 0 | 257 |
As shown in Table 2 the average daily balances increased from $36 billion to $174 billion in nominal terms between 2001 and 2019. Note the variability in fund balance from year to year as reflected in the standard deviations and minimum/maximum values. Why does a passively managed government securities fund fluctuate so dramatically from day to day? There is a zero balance that occurred at some point over the course of a year in seven of the 20 years for which we have data. Figure 1 offers clearer picture of fund balances from day to day over the entire period. Fund balances declined significantly for some days in the early 2000s and then were stable for several years. Then beginning in 2009 there were an increasing number of events wherein the daily fund balances dropped dramatically, in some cases for months at a time.
Because the G Fund is entirely composed of securities with one-day maturities, government reports indicated that entire balance of the G Fund is redeemed and reissued every day. One-day securities are the source of the massive redemptions and reissuance reported by Treasury, as discussed in our previous report (Skidmore and Fitts, 2020,). This information provides an answer to the question we posed: Why is government reporting many $10s of trillions in redemptions and reissuance? The explanation is that some of its internal debt is held as one-day securities, which requires daily turnover. Table 3 and Figure 2 present data on the turnover (redemptions and reissuance) required for the G Fund. The needed annual turnover increased from about $9 trillion in 2001 to $55 trillion in 2018, before dropping to $44 trillion in 2019. However, the turnover only dropped off in 2019 because the average fund balances declined dramatically during the months of March through July, as shown in Figure 1. Table 2 also shows 1, 25, 50, 75, and 99 percentile values for the daily balances for each year. In some years, such as 2001, the balances are stable. However, in other years such as 2019 the balance ranges between $22 billion and $257 billion. Figure 2 shows year over year cases when the required turnover increases by as much as $24 trillion (2015-2016) and falls by as much $18 trillion (2016-2017). Figures 1 and 2 also show that while the general trend is increasing over time (the dotted lines on the graphs), there is also substantial variation in fund balances from day to day and from year to year. Why?
Figure 1: Thrift Savings Fund G Fund Daily Balance ($ billions): 2001-2020
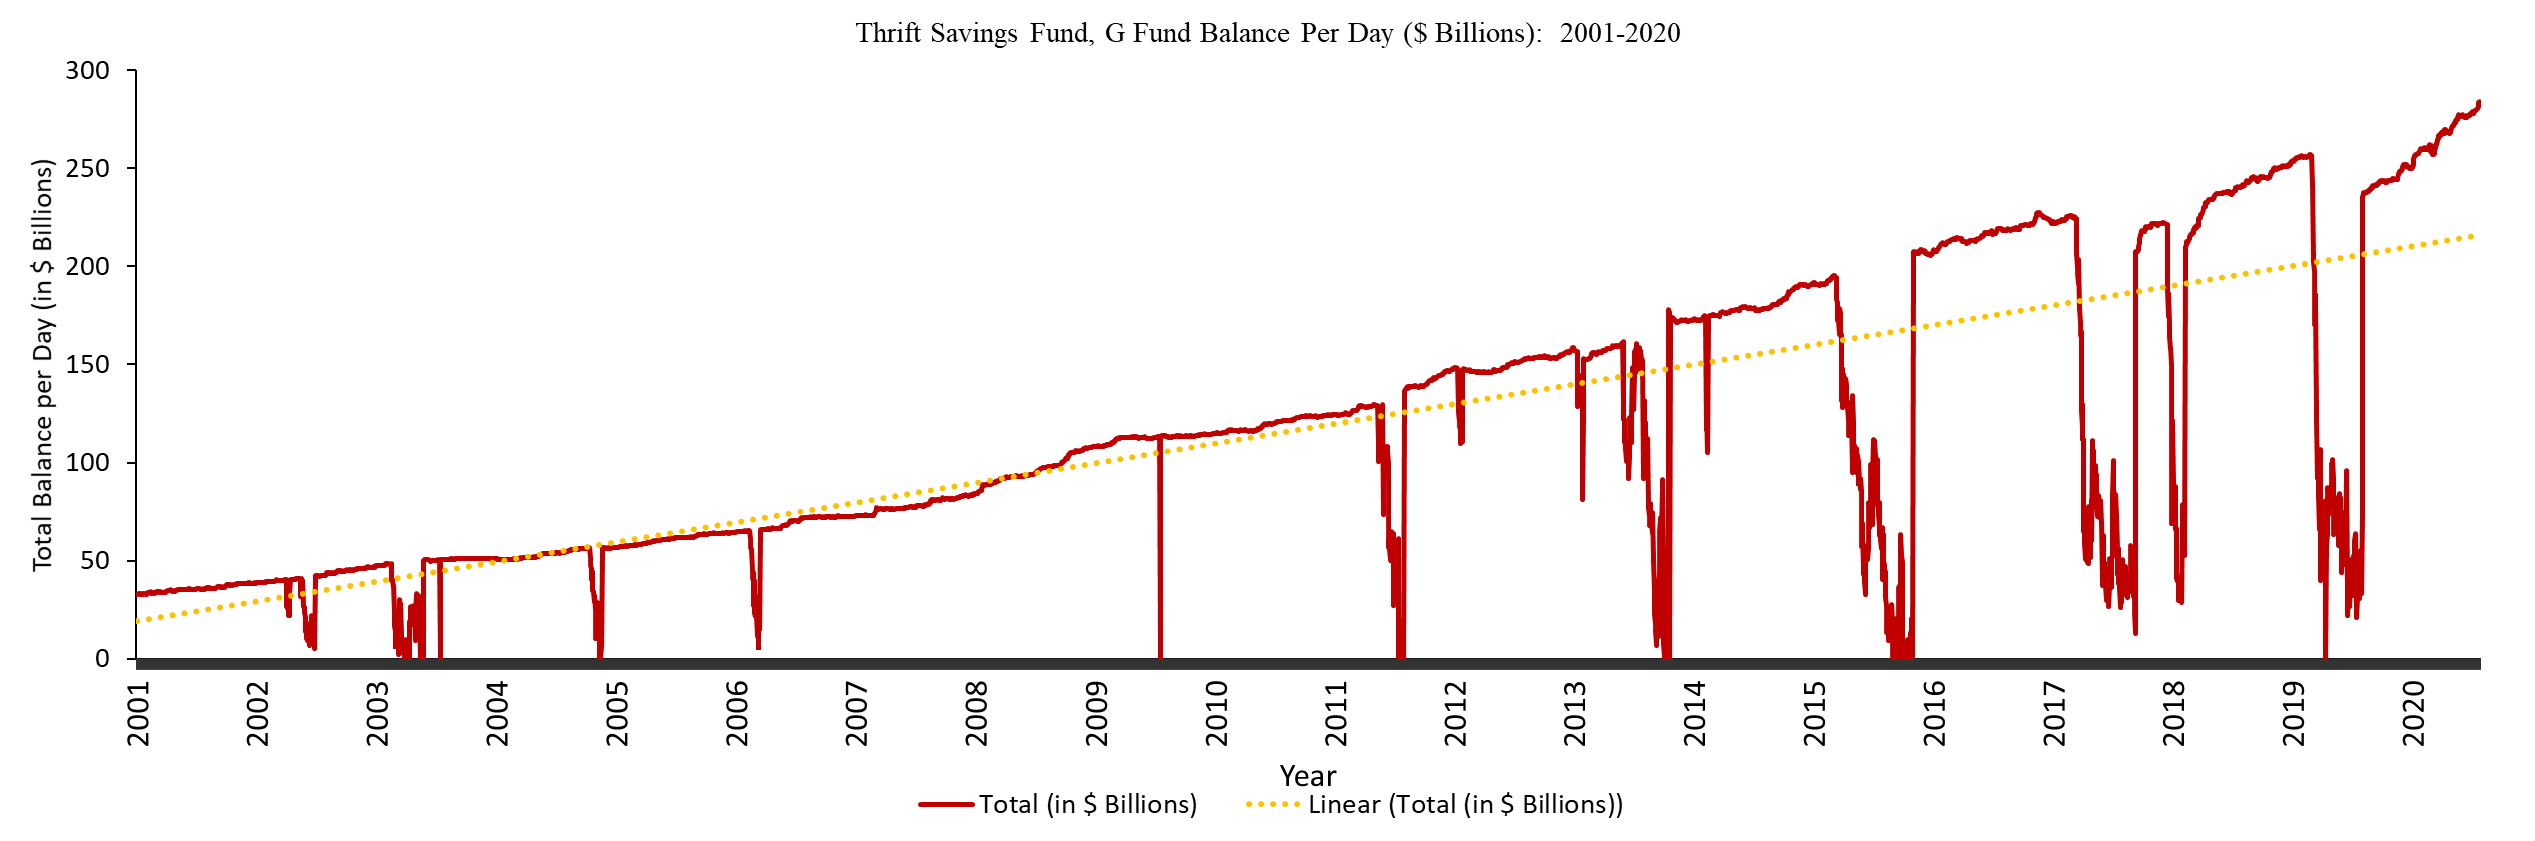
Table 2: Thrift Savings Fund G Fund Average Annual Required Turnover ($ billions): 2001-2019
| Year | Required Turnover | p1 | p25 | p50 | p75 | p99 |
|---|---|---|---|---|---|---|
| 2001 | 8,940 | 33 | 34 | 36 | 37 | 39 |
| 2002 | 9,879 | 7 | 39 | 42 | 45 | 47 |
| 2003 | 10,265 | 0 | 33 | 50 | 51 | 51 |
| 2004 | 12,694 | 4 | 51 | 54 | 56 | 57 |
| 2005 | 15,348 | 57 | 59 | 62 | 64 | 64 |
| 2006 | 16,606 | 12 | 66 | 70 | 72 | 73 |
| 2007 | 19,652 | 73 | 76 | 78 | 81 | 84 |
| 2008 | 24,312 | 84 | 92 | 95 | 101 | 108 |
| 2009 | 28,141 | 108 | 113 | 113 | 114 | 115 |
| 2010 | 29,966 | 115 | 116 | 120 | 123 | 125 |
| 2011 | 29,862 | 0 | 124 | 129 | 139 | 148 |
| 2012 | 37,361 | 111 | 147 | 151 | 154 | 158 |
| 2013 | 33,235 | 0 | 112 | 156 | 159 | 175 |
| 2014 | 44,955 | 116 | 176 | 179 | 183 | 191 |
| 2015 | 29,163 | 0 | 48 | 112 | 192 | 208 |
| 2016 | 54,522 | 208 | 213 | 217 | 221 | 227 |
| 2017 | 36,024 | 26 | 56 | 182 | 222 | 226 |
| 2018 | 55,046 | 29 | 227 | 238 | 245 | 253 |
| 2019 | 43,643 | 22 | 74 | 241 | 250 | 257 |
Figure 2: Thrift Savings Fund G Fund Annual Turnover ($ billions): 2001-2019
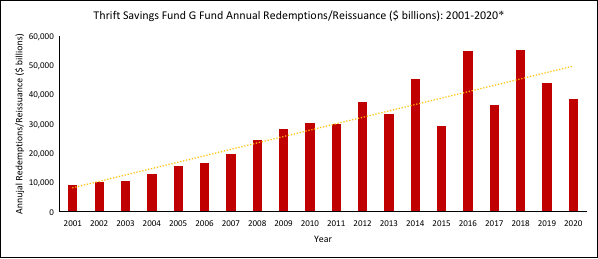
*Data for 2020 are partial, running from January 1, 2020 through July 24, 2020.
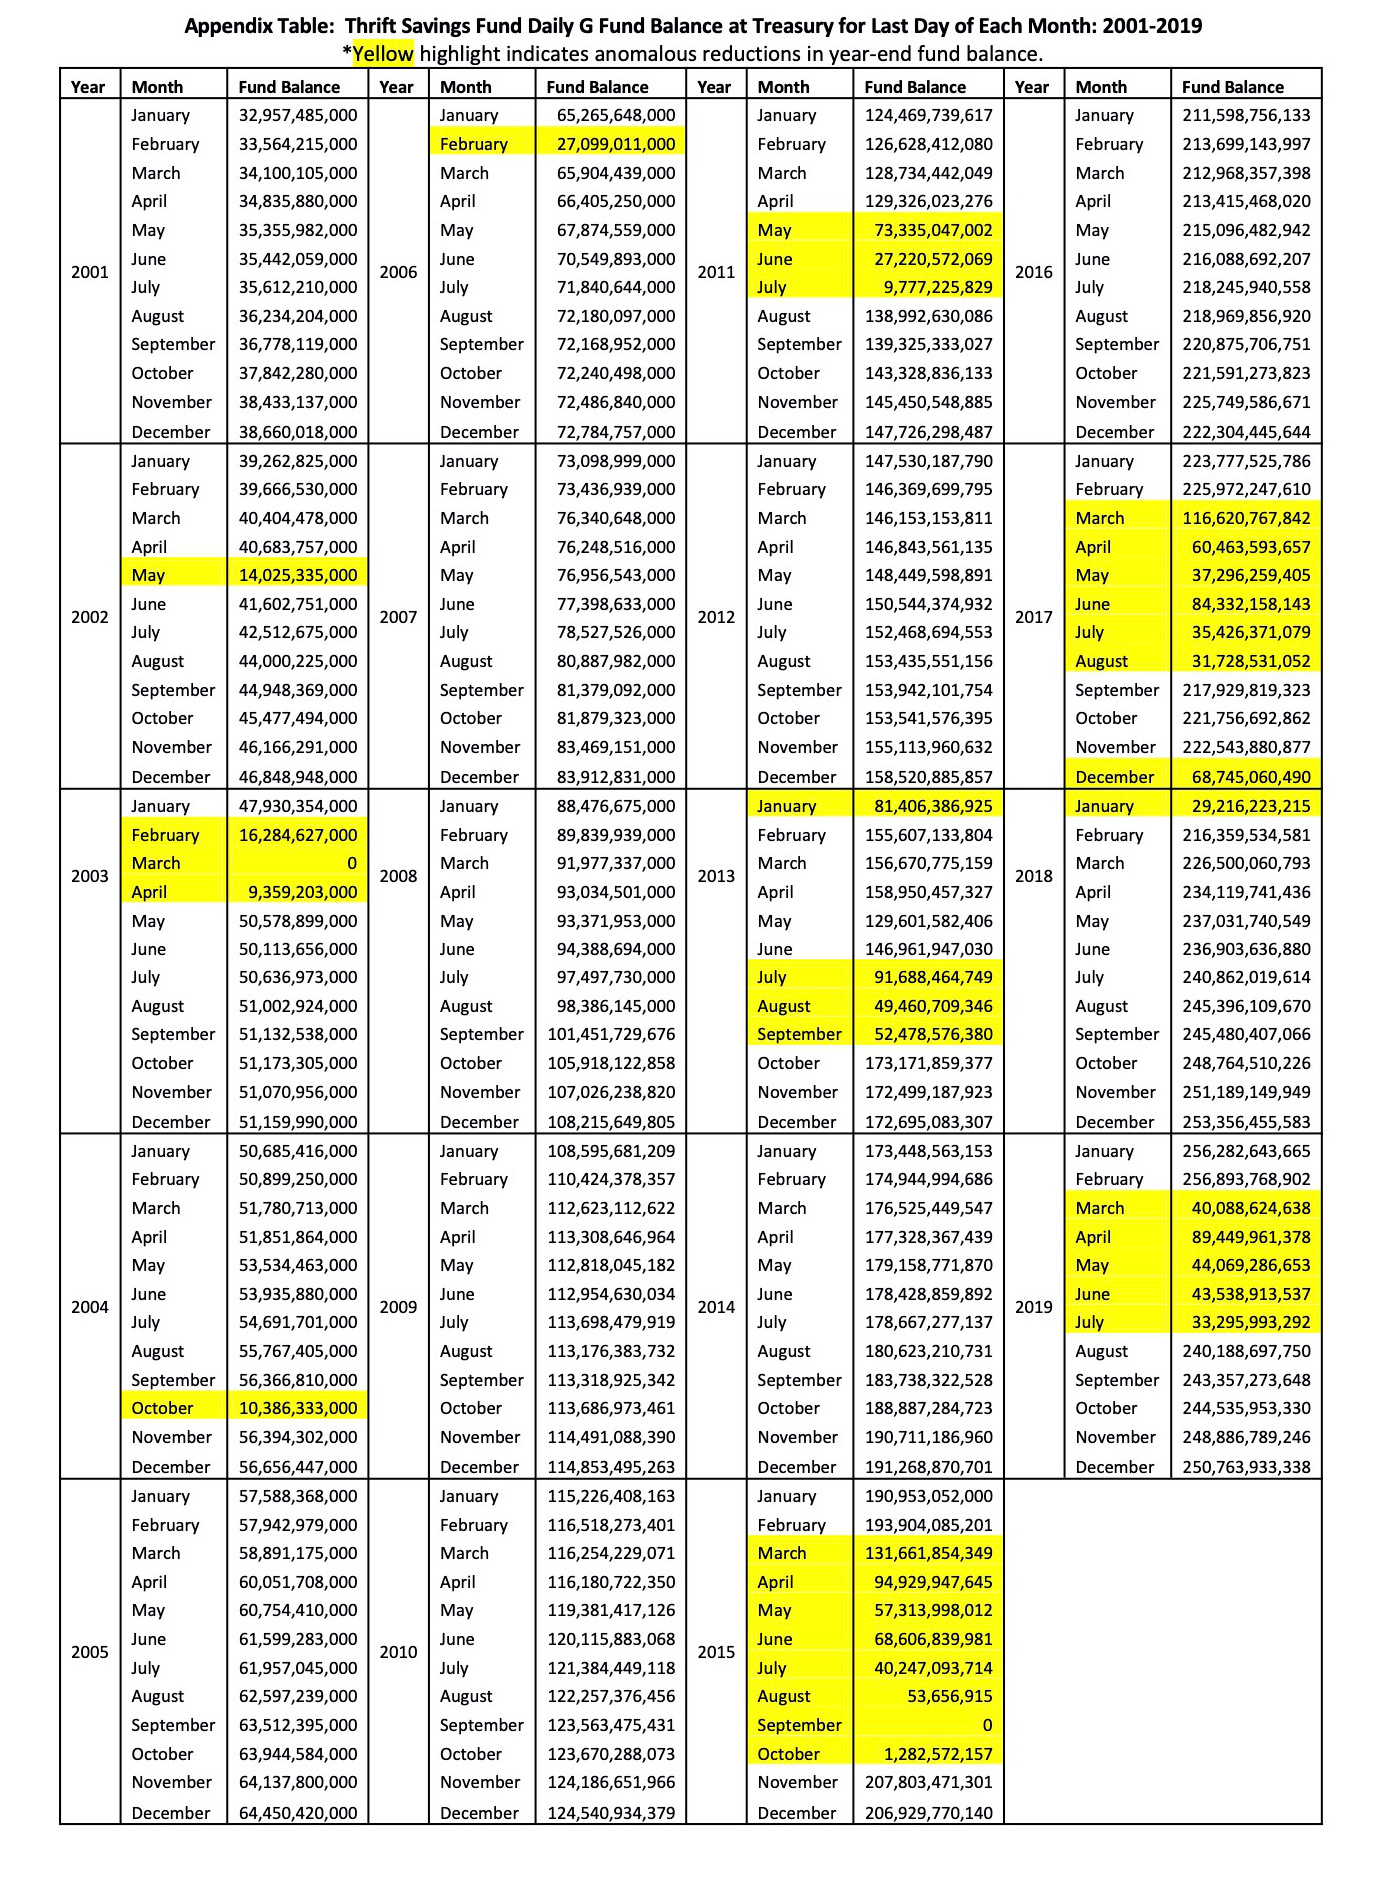
The Appendix Table presents the reported end of month fund balances for years 2001 through 2019. The data show that over time the G Fund increased from $33 billion in early 2001 to $251 billion in 2019 in nominal terms, representing a 660% increase. The Appendix also provides links to the financial statements of the Thrift Savings Fund for years 2009-2018, which report the balances on the last day of each fiscal year for each of the funds in the portfolio, including the G Fund. The balances reported in the table for the last month of each year match those reported in the financial statements except for 2017. In 2017, the Treasury website records a balance of $69 billion, but the financial statement indicates a balance of $220 billion.
Given that this is a retirement fund with a stated passive investment strategy, one would expect balances in each of the funds managed, including the G Fund, to be reasonably stable from day to day and month to month. However, there is significant variability over time. Figure 1 as well as the months highlighted in yellow in the Appendix Table show dramatic reductions in fund balances, sometimes for several months at time. Then as quickly as the fund balance declined, it returned to its pre-decline levels. These observations spur several questions:
- Why is the G Fund composed entirely of securities with one-day maturities that are turned over every business day?
- Why do the daily balances drop dramatically in some periods and then return to their previous levels?
- Where did those funds go in the months when the G Fund decreased so substantially?
- Did fund managers at Treasury work with BlackRock to push those funds into financial markets?
- Did those funds generate a return during the months when the fund balance low, and if so, how much?
- Did the gains accrue to the federal employees and retirees who contributed to the fund?
- Is the fluctuation in the daily fund balance we observe consistent with the stated passive management strategy used for the Thrift Savings Plan?
- Are federal employees and retirees who have allocated their savings to this fund aware of the fluctuations occurring with their retirement savings? Would they approve of such movements?
- Is holding the entire G Fund in one-day securities legal?
- Do other large retirement funds move $10s or $100s billions in and out of government securities on daily or monthly basis?
- Is it feasible to use those funds for public investment or spending (as is the case with other government security instruments) when they are turned over every business day?
- Do the dips in the fund balance correlate with significant financial market events?
- Are these funds being used for purposes other than to generate a return for current and future federal government retirees?
- Does this information suggest that there may be outstanding debt in excess of the official debt?
We bring these questions to the forefront, focusing on the Thrift Savings Fund. However, we also note that several other funds managed by Treasury have a substantial amount of securities with one-day maturities. Take for example the following funds:
- 020×444 Exchange Stabilization Fund (~$11 billion in one-day securities in 2019)
- 097×8097 Department of Defense Military Retirement Fund (~15 billion in one-day securities in 2019)
- 097×5472 Department of Defense, Medicare-Eligible Retire Health Care Fund (~5 billion in one-day securities in 2019)
These three funds generated roughly ~$8 trillion in turnover (redemptions and reissuance) in 2019. Note the larger funds such as the Federal Old-Age and Survivors Fund, Federal Disability Insurance Trust Fund, and the Federal Supplementary Medical Insurance Trust Fund do not hold one-day securities, at least not in the years we checked. In future work, it will be important to systematically review each of the more than 700 funds to tally the total dollar amount of securities with one-day maturities, and carefully consider the purposes for holding so much internally held federal government debt in securities with one-day maturities. We hope the readers understand how extraordinary and unusual this situation is and are spurred to inquire further about the nature and purposes of the holding $100s of billions in one-day securities. What is going on?
References
Federal Reserve Bank of New York. 2020. Overnight Funding Rate Data. Available at https://apps.newyorkfed.org/markets/autorates/obfr.
Federal Retirement Thrift Investment Board. 2018. Thrift Savings Fund Financial Statements. Available at https://www.frtib.gov/ReadingRoom/FinStmts/TSP-FS-Dec2018.pdf.
Skidmore, M. and Fitts, C. Missing Money Update. Available at https://missingmoney.solari.com/missing-money-update-may-2020/.
Thrift Savings Plan, 2010. Thrift Savings Plan G Fund. Available at https://web.archive.org/web/20110721074402/https://www.tsp.gov/PDF/formspubs/GFund.pdf.
Thrift Savings Plan. 2020. Thrift Savings Plan. Available at https://www.tsp.gov/.
Thrift Savings Fund, 2018. Thrift Savings Plan Financial Statement. Available at https://www.frtib.gov/ReadingRoom/FinStmts/TSP-FS-Dec2018.pdf.
United States Department of Treasury, 2020a. “Daily Statement of Public Debt.” Available at Daily Treasury Statement for September 30, 2019 (the last day of the fiscal year) for a summary: https://fsapps.fiscal.treasury.gov/dts/issues/.
United States Department of Treasury, 2020b. Treasury Direct website: https://www.treasurydirect.gov/govt/reports/fip/investments-distribution-query/report.html.
Wikipedia, 2020a. Wikipedia Entry on the Thrift Savings Plan. Available at https://en.wikipedia.org/wiki/Thrift_Savings_Plan
Wikipedia, 2020b. Wikipedia Entry on Passive Management. Available at https://en.wikipedia.org/wiki/Passive_management.
Appendix
Thrift Savings Board Financial Statements
December 31, 2018 and 2017
TSP Financial Statements
December 31, 2017 and 2016
TSP Financial Statements
December 31, 2016 and 2015
TSP Financial Statements
December 31, 2015 and 2014
TSP Financial Statements
December 31, 2014 and 2013
TSP Financial Statements
December 31, 2013 and 2012
TSP Financial Statements
December 31, 2012 and 2011
TSP Financial Statements
December 31, 2011 and 2010
TSP Financial Statements
December 31, 2010 and 2009
TSP Financial Statements
Footnotes
1 We thank Tom Stanis for bringing the issue of the very large Treasury redemptions to our attention and for valuable discussions that helped inform this report. We also thank Camila Alvayay Torrejón for capable research assistance.
2 Figure 1 reports data for the first part of 2020 as well.
* Department of Agricultural, Food, and Resource Economics/Department of Economics, Michigan State University, 91 Morrill Hall of Agriculture, East Lansing, MI 48824-1039; mskidmor@msu.edu; 517-353-9172.
** Solari, Inc., P.O. Box 157, Hickory Valley, TN 38042; catherine@solari.com.
*** Kirby Analytics; rkirby@kirbyanalytics.com.
**** Software Engineer.