Missing Money Update1

Mark Skidmore* and Catherine Austin Fitts**
May 2020
PDF Copy Available Here.
Related Documents:
- Pentagon Racks Up $35 Trillion in Accounting Changes in One Year
Bloomberg, January 22, 2021 - July 2019 FOIA Request
- July 2019 DOD FOIA Acknowledgement Email
- September 2019 DOD Email
- November 2019 DOD FOIA Transfer to Redstone Arsenal
- March 2020 DOD Responsive Documents
In February of 2019, Mark Skidmore and Catherine Austin Fitts published the report “Should We Care about Secrecy in Financial Reporting?” (Skidmore and Fitts, 2019), which provided a review and assessment of the state of federal government financial reporting and the lack of transparency therein. Since that report was published, several new developments have emerged. In this document, we provide an update on the state of federal government financial reporting on both uses and sources of revenue. We begin with a discussion of uses. On the uses side, we discuss new information from the Office of the Inspector General (OIG) regarding 170 unsupported journal voucher adjustments tallying to $2.1 trillion. These 170 adjustments were briefly mentioned in a 2016 OIG document for the fiscal year 2015 Army General Fund financial report in which the Army was found to have $6.5 trillion in unsupported journal voucher adjustments in that year. We also discuss a request by the Department of Defense to conceal future spending projections.
On the sources side of the ledger, we offer a preliminary evaluation of federal government debt issuance and redemptions by the United States Department of Treasury (Treasury). Recall that we identified through official federal government sources $21 trillion in unsupported journal voucher adjustments over the 1998-2015 period (Kotlikoff and Skidmore, 2017). As discussed in the past, one potential explanation for the ongoing enormous unverified transactions is that the federal government has spent far more than is officially recognized. If this is the case, then we must ask from where the funds came. One possibility is that there has been much more debt issuance than the official debt records indicate. It is important to note that while we have an official record of debt from the issuer (the U.S. government), to our knowledge it is impossible to tally debt from the debt holder side as there is no comprehensive record of who actually owns government securities. Treasury does, however, report a tally of total debt issuance and redemptions on a daily, monthly, and annual basis.
In 2019, the federal government reported a total debt of about $22 trillion. In the same year, total debt issuance was $91 trillion, whereas total redemptions were about $90 trillion. The difference between issuance and redemptions (about $1 trillion) reflects the new borrowing that occurred in 2019. The remaining $90 trillion in debt issuance is due to debt turnover; when bills, notes, bonds, and other debt instruments come to term, Treasury must issue a new debt to replace the redeemed funds. The amount of debt turnover in any given year depends greatly on the composition of the debt with regard to term-length. Long-term debt requires less turnover and reissuance to service, whereas servicing short-term debt requires significant turnover and thus reissuance. In this report, we offer an initial assessment of what total issuance should be to service the official debt of $22 trillion and compare that figure to the $91 trillion in total issuance as reported by Treasury. Our preliminary evaluation suggests that the Treasury may be servicing far more than $22 trillion in official debt. Though this assessment is still a work in progress, we present initial findings to stir further inquiry and solicit ideas and feedback on what may be happening with federal debt issuance and redemptions.
Uses
FOIA Request—Army Unsupported Journal Voucher Adjustments
In 2016, the OIG issued the document “Army General Fund Adjustments Not Adequately Documented or Supported (U.S. Department of Defense, 2016)” which indicated that in fiscal year 2015 the Army general fund had $6.5 trillion in unsupported accounting adjustments. Given that the Army’s general fund budget was approved at $122 billion, $6.5 trillion is an astounding figure that is 54 times authorized spending. As discussed previously, unsupported accounting adjustments are typically a small fraction of (rather than many multiples of) authorized spending. The OIG report provided little detail regarding the nature of the unsupported adjustments. However, on page 6 of the document, there is a reference to 170 unsupported adjustments that accounted for $2.1 of the $6.5 trillion summarized in the report. The following was stated in the document:
We determined that 236, totaling $2 trillion, of the 263 third quarter JV [journal voucher] adjustments in our sample and 170, totaling $2.1 trillion, of the 194 yearend JV adjustments in our sample, were in fact unsupported because the adjustments:
- forced general ledger amounts to agree with other data sources without reconciling the differences or determining which data source was correct;
- corrected errors or reclassified amounts to other accounts without adequately documenting why the adjustments were needed; or
- changed general ledger data without adequate documentation to support the adjustments.
While it is unlikely that the OIG would respond to a request for detailed information about the nature of the entire $6.5 trillion in unsupported adjustments, it seemed to be a good strategy to request and expect a response for more information regarding the 170 unsupported adjustments tallying to $2.1 trillion. In July of 2019, Mark Skidmore submitted a Freedom of Information Act (FOIA) request asking for more detail about these unsupported adjustments: the dollar magnitudes of each item, the explanation from the Army regarding the nature of the questionable transactions, and descriptions of why the OIG considered the adjustments to be unsupported (Skidmore, 2019). On March 31, 2020, Dr. Skidmore received a response with a document that contained the dollar amounts and some information about the nature of each transaction. The original FOIA request (Skidmore, 2019) and the OIG’s response document (Office of the Inspector General, 2020) can be found at the Solari Missing Money website.
The document provided by the OIG offered brief and incomplete explanations for each of the 170 unsupported adjustments. The explanations were oftentimes cut off, making the full explanation unavailable. The explanations were diverse, including but not limited to “data call,” “bringing balances into agreement,” reversing other journal vouchers, “identifying errors and reasonableness checks,” “disclosing the population of adjustments,” “abnormal balances,” “reconcile general ledger disconnects,” and “customer is unable to provide information.” Below, we list the 10 largest unsupported adjustments, which tally to about $1.15 trillion.
Top 10 Unsupported Journal Voucher Adjustments
| JVID | Stated Purpose | Amount |
|---|---|---|
| FY 2015- ELECTRA- Sept | This JV is created to disclose the population of adjustments that Departmental Accounting submitted as Report Data Type (ROT) transactions. | $ 177,417,491,279 |
| 20153780029 | The purpose of this adjustment is to bring AT21A99 first Quarter, FY 2014, beginning balances for the Component Level entity trial balances into agreement with the FY 2013 Post Closing balances as reflected in the Defense Departmental Reporting System (DDRS). | $ 165,989,255,290 |
| 20153780057 | The purpose of this adjustment is to reverse iV 5006. After the GTAS implementation, this trial balance populated BS 2020 GTAS Component Trial Balance Staging Area in DDRS-B. This adjustment is causing GTAS Edits to fail in DDRS-B for BS 2020. Once thi [explanation cut off] | $ 165,989,255,290 |
| 20153780055 | This adjustment is being performed to bring in the beginning balances for the program level AT21AF1 trial balance (Level 4). Datacalls are applied to this entity at the program group level (Level 3), as the customer is unable to provide information at the [explanation is cut-off] | $ 163,114,566,279 |
| 20153824165 | DATA CALL: The Military Equipment - Financial Statement Tool (ME-FST) is the system that was developed to maintain and update military equipment valuation data. ASA (FM&C), Financial Reporting provided Departmental Reporting with a spreadsheet of the ME [explanation cut off] | $ 92,674,067,778 |
| 20154592104 | GTAS No SBR Impact: Adjustments made in DDRS-AFS have been reported back into DDRS-B for the purpose of GTAS reporting. This JV will reverse those balances in DORS-B. By the criteria used in support of the accounting entries metrics, this journal voucher i [explanation cut off] | $ 88,409,257,166 |
| 20155331826 | GTAS No SBR Impact: Adjustments made in DDRS-AFS have been reported back into DDRS-B for the purpose of GTAS reporting. This JV will reverse those balances in DORS-B. By the criteria used in support of the accounting entries metrics, this journal voucher i [explanation cut off] | $ 88,409,257,166 |
| 20156103709 | Category H _ Reasonableness Checks - The purpose of this adjustment to clear an abnormal balance submitted against GLAC 7190000.9010 (Other Gains? No Budgetary Impact). Review of 2nd quarter FY 2015 DDRS-B JV1$20155327873 shows that GLAC 7190 was used in [explanation cut off] | $ 86,114,452,693 |
| 20155014900 | FUNDING Category H - Identified Errors and Reasonableness Checks. SBA/SBR Impact. GFEBS is submitting funding changes against GLACs 109000.9000 (Fund Balance with Treasury under a Continuing Resolution (CRA)) and GLACs 439500.9000 (Authority Unavailable) | $ 74,121,430,756 |
| 20156103679 | DATA CALL: The Military Equipment - Financial Statement Tool (ME-FST) is the system that was developed to maintain and update military equipment valuation data. ASA (FM&C), Financial Reporting provided Departmental Reporting with a spreadsheet of the ME [explanation cut off] | $ 48,863,576,811 |
While this documentation allows us to ask additional questions, the actual content is not very informative. In some cases, amounts appear twice, perhaps to embed corrections on each side of a given ledger. Some of the adjustments can be described as “plugs” in the sense that budgets did not agree with actual spending. Presumably, these adjustments were made in order to reconcile accounts. In one case, the explanation indicates that a customer was unable to provide adequate information, but the statement is cut off so that we cannot know what it was the customer could not provide. While many of the explanations sound reasonable, they are not when one considers the magnitudes of the adjustments in the context of the $122 billion budget. As one example, there is a $163 billion unsupported adjustment that was the result of a customer not being able to provide adequate information. While it is sometimes the case that a customer is unable to provide adequate documentation, the $163 billion magnitude is much too large to report as unsupported and then ignore it thereafter. Another $74 billion unsupported adjustment is due to “errors and reasonableness checks.” This one error is more than half of authorized spending in fiscal year 2015. Under normal circumstances, an unsupported transaction of this magnitude would be a considered a red flag for potential fraud.
Unfortunately, without additional information it is impossible to assess any further. Ordinarily, it would be reasonable to expect an auditor to track down and verify unsupported adjustments of these magnitudes, and yet for some reason, these enormous adjustments are reported as unsupported and to our knowledge remain so without any further inquiry. Public confidence depends wholly on the degree to which the public believes our authorities are offering reliable financial statements. In our assessment, with unsupported adjustments of this magnitude, the Army’s financial statements cannot be relied upon. Further, we are unable to verify on our own because we do not have access to transaction-level data and associated documentation, nor the resources to pursue inquiry. Keep in mind that these 170 unverified transactions accounting for $2.1 trillion represent just a third of the $6.5 trillion documented in the original OIG report.
Also recall that high-level government authorities recently implemented Federal Accounting Standards Advisory Board (FASAB) Standard 56, which allows the creation of two financial statements, one for the public that contains misleading information, and another accurate report that can only be seen by a limited number of officials with the proper security clearances (Skidmore and Fitts, 2019). Importantly, FASAB Standard 56 provides little to no constraint on the degree to which federal government financial statements can be modified to conceal expenditures that are deemed to be a matter of national security.
Secrecy in Future Spending
On March 30, 2020, Steven Aftergood reported in “Secrecy News” (Aftergood, 2020) that the Department of Defense (DOD) has requested that Congress rescind the requirement to produce an unclassified version of the Future Years Defense Program (FYDP) database. The stated concern is that publishing the FYDP might reveal sensitive information. While the proposal would preserve a classified version of the FYDP, note that the request also includes a repeal of the requirement that DOD officials certify that the data used to construct the FYDP are accurate. Aftergood concludes that removal of this budgeting requirement “would make it even harder for Congress and the public to refocus and reconstruct the defense budget.” Currently, the degree to which the proposed changes would reduce transparency is unclear, but if the opacity of the DOD budget increases, it will become even more difficult to assess actual DOD spending. FASAB Standard 56 already makes it impossible for the public to know with any degree of certainty what actual spending was for the DOD or any other federal agency or entity. If the request to rescind the FYDP requirement is granted, and it reduces the availability of information on spending plans, citizens will not be able to verify the legality of past spending due to Standard 56 nor have access to future spending plans due to the elimination of FYDP.
Sources—How Much Annual Debt Issuance Is Needed to Service the Federal Debt?
One possible explanation for the enormous unsupported adjustments is that over time the federal government has spent more than has been authorized or officially recognized. If this is the case, then we must consider the potential sources of the additional funds. One possibility is that over time the Treasury has issued more bills, notes, and bonds than is recognized and reflected in the official federal debt figures.
In fiscal year 2019, the federal government had a total debt of about $22 trillion. During the same year, the government redeemed about $90 trillion in bills, notes, bonds, and other debt instruments, and it issued about $91 trillion of those debt instruments.2 The total debt increased by $1.2 trillion in 2019; roughly the difference between issuance and redemptions represents new debt issuance in that year. The remaining $90 trillion is reissuance to service existing debt. We refer to the redemption-reissuance dynamic as “debt turnover.”
The need for reissuance depends on the composition of the debt by term-length. The table below summarizes the term-lengths for different types of federal debt.
Debt Types
Bills (4, 8, 13, 26, and 52 weeks)
Notes (2, 3, 5, 7, and 10 years)
Bonds (30 year)
TIPS (5, 10, 20, and 30 year)
Floating Rate Notes
Federal Financing Bank
Domestic Series
Foreign Series
State & Local Government Series
U.S. Savings Securities
Government Account Series (on demand to 30 year)
In any given year, the government issues bills, notes, bonds, and other minor instruments to the public. It also issues non-marketable debt internally, most of which is issued as “Government Account Series.” For example, the Social Security Trust Fund is composed of internally held debt. The bolded categories are those debt instrument categories with significant amounts of debt, accounting for more than 90 percent of the total. One- to five-year term public debt issuance accounts for the largest share of total debt at 43.5%, which is followed by Government Account Series issuance (28%), and issuance of less than one-year term debt (8.7%).
Every year, the federal government must issue enough bills, notes, and bonds to satisfy deficit spending plus reissue existing debt that has been redeemed. For long-term 30-year bonds, on average about 3.3 percent of that debt would be redeemed in any given year, and then new debt of some term-length reissued. However, precisely how much of this long-term debt is redeemed in any particular year depends on the dates and composition of past debt issuance, so the percentage redeemed varies from year to year. At the other end of the term-length spectrum, there are short-term bills, of which the shortest term is 4 weeks. This short-term debt would require annual turnover of 13 to maintain the debt in this category (52 weeks divided by 4 equals 13). Thus, for long-term debt there is relatively little turnover annually, but short-term debt requires a much higher rate of turnover to service those obligations.
How much turnover is required to service $22 trillion in debt? The answer to this question depends on how much debt is in shorter-term versus longer-term status. To put parameters around the possible turnover and reissuance, consider two boundary cases. If the entire $22 trillion of debt in 2019 were to be denoted in four-week bills, the needed turnover would be 13 x $22 trillion, which equals $286 trillion. On the other end of the spectrum, if all debt were to be denoted in 30-year bonds, then only 3.3 percent of the debt would require redemption and reissuance, or about $0.72 trillion, annually. These two scenarios show the importance of term-length in determining needed debt reissuance to support the federal debt on an annual basis. The goal here is to compare the reported $90 trillion in bills, notes, and bond reissuance in 2019 with a calculation of the turnover that would be needed to support the $22 trillion in total debt using data on the composition of the debt by term-length. This comparison offers an assessment of whether $90 trillion is the right amount of reissuance.
Our evaluation uses detailed information from the U.S. Department of Treasury regarding how much debt is held in shorter-term versus longer-term lengths.3 As summarized earlier, Treasury bills are issued in 4, 8, 13, 26, and 52-week term-lengths. Notes are issued in 2, 3, 5, 7, and 10-year term-lengths, and bonds are issued in a 30-year term. Treasury Inflation-Protected Securities are issued in 5, 10, 20, and 30-year term-lengths. Government Account Series debt has term-lengths ranging from “on demand” to 30-year; however, we have not been able to find information on the composition of non-marketable public debt by term-length.
In our evaluation, we aggregate the total amount of debt held in each term-length category. We then calculate how much debt would have to be reissued within each category to support that portion of the debt throughout the year. Because we have been unable to find information on the term-lengths of non-marketable debt such as Government Account Series debt instruments, we assume that internally held public debt is distributed in the same way that the publicly held debt is distributed.
In the table below, we present a summary of public debt for each debt instrument, which includes information on term-length, the turnover factor that determines the amount of reissuance that would be required to service the debt, and the amount of debt reissuance needed to service the federal debt in 2019. At the bottom of the table you will see that the total debt sums to about $22 trillion. The last column to the far right of the table shows the amount of debt reissuance that would be needed to service the debt in each term-length category. The first row contains the 4-week Treasury notes, which requires turnover of 13 over the course of a year to service that debt. Therefore, reissuance would be 13 times $205 billion, or $2.7 trillion to fully service that component of the federal debt. We repeat this calculation for each term-length component of the federal debt. As discussed earlier, given that we do not have term-length information for non-marketable debt, we assume the turnover for that debt to be the same as the marketable debt. Our calculations show that a $16 trillion reissuance would be needed to service the total federal debt in fiscal year 2019. We think this is a higher-end estimate because it seems likely that most Government Account Series would be longer-term debt and thus would require less turnover than the publicly held debt.
As a further consideration of the non-marketable debt component, additional evaluation may be useful. The largest component of debt in this category is the Social Security Trust Fund. According to the Treasury Daily Yield Curve Rate website, over the course of 2019 the yield on a four-week note ranged from 1.48 to 2.51 percent (Treasury, 2019). According to the Social Security Fund Consolidated Balance Sheet, total assets were about $2.9 trillion with interest earnings of $81.7 billion, which generates a rate of return of about 2.8 percent (U.S. Social Security Administration, 2019). Thus, we can safely conclude that non-marketable debt was not exclusively held in 4-week notes; if it was held as short-term instruments, the rate of return would have been lower, between 1.48 and 2.51 percent.
It is possible that non-marketable debt requires more turnover than publicly held debt. As another scenario, we could assume the average debt held in Government Account Series has double the turnover rate of publicly held debt. Under these assumptions, the required redemptions/reissuance for non-marketable debt would increase from $4.5 trillion to $9 trillion. Even under this unrealistic assumption, we find debt turnover and reissuance would only increase from $16 trillion to $20 trillion.
Debt and Debt Turnover by Term-length |
||||
|---|---|---|---|---|
| Instrument | Length | Total Issued Debt | Turnover Factor | Turnover Required |
| Treasury Bills (Maturity Value) | 4 weeks | $ 204,988,000,000 | 13 | $ 2,664,844,000,000 |
| 8 weeks | $ 315,016,000,000 | 7 | $ 2,047,604,000,000 | |
| 13 weeks | $ 530,992,000,000 | 4 | $ 2,123,968,000,000 | |
| 26 weeks | $ 983,974,000,000 | 2 | $ 1,967,948,000,000 | |
| 52 weeks | $ 341,990,000,000 | 1 | $ 341,990,000,000 | |
| Subtotal | N/A | $ 2,376,960,000,000 | N/A | $ 9,146,354,000,000 |
| Treasury Floating Rate Notes | 2-year | $ 424,066,000,000 | 0.50 | $ 212,033,000,000 |
| Subtotal | N/A | $ 424,066,000,000 | N/A | $ 212,033,000,000 |
| Treasury Notes | 2-year | $ 909,112,000,000 | 0.50 | $ 454,556,000,000 |
| 3-year | $ 1,186,880,000,000 | 0.33 | $ 395,626,666,667 | |
| 5-year | $ 2,315,969,000,000 | 0.20 | $ 463,193,800,000 | |
| 7-year | $ 2,587,610,000,000 | 0.14 | $ 369,658,571,429 | |
| 10-year | $ 2,763,304,000,000 | 0.10 | $ 276,330,400,000 | |
| Subtotal | N/A | $ 9,762,875,000,000 | N/A | $ 1,959,365,438,095 |
| Treasury Inflation-Protected | 5-year | $ 218,686,000,000 | 0.20 | $ 43,737,200,000 |
| Securities | 10-year | $ 746,230,000,000 | 0.10 | $ 74,623,000,000 |
| 20-year | $ 94,268,000,000 | 0.05 | $ 4,713,400,000 | |
| 30-year | $ 246,013,000,000 | 0.033 | $ 8,200,433,333 | |
| Subtotal | N/A | $ 1,305,197,000,000 | N/A | $ 131,274,033,333 |
| Treasury Bonds | 30-year | $ 2,352,071,000,000 | 0.033 | $ 78,402,366,667 |
| Subtotal | N/A | $ 2,352,071,000,000 | N/A | $ 78,402,366,667 |
| Total Marketable Securities | N/A | $ 16,221,169,000,000 | N/A | $ 11,527,428,838,095 |
| Non-Marketable Securities | N/A | $ 6,372,061,000,000 | 0.71 | $ 4,524,163,310,000 |
| Total Non-Marketable Securities | N/A | $ 6,372,061,000,000 | N/A | $ 4,524,163,310,000 |
| Overall Total | N/A | $ 22,593,230,000,000 | N/A | $ 16,051,592,148,095 |
Assuming the $16 trillion calculation for required debt reissuance to support the $22 trillion debt is roughly accurate, then why does the Treasury report $90 trillion in redemptions and $91 trillion in issuance in 2019? The reported issuance is 5.6 times what appears to be needed to service the debt. Far from an isolated event, this seeming discrepancy has been present for years, but the divergence between officially reported debt and the recorded debt issuance has expanded over time. The graph below compares debt issuance (and redemptions) with the total federal debt for the years 2000 through 2019.
Issuance, Redemptions, and Total Debt, 2000-2019
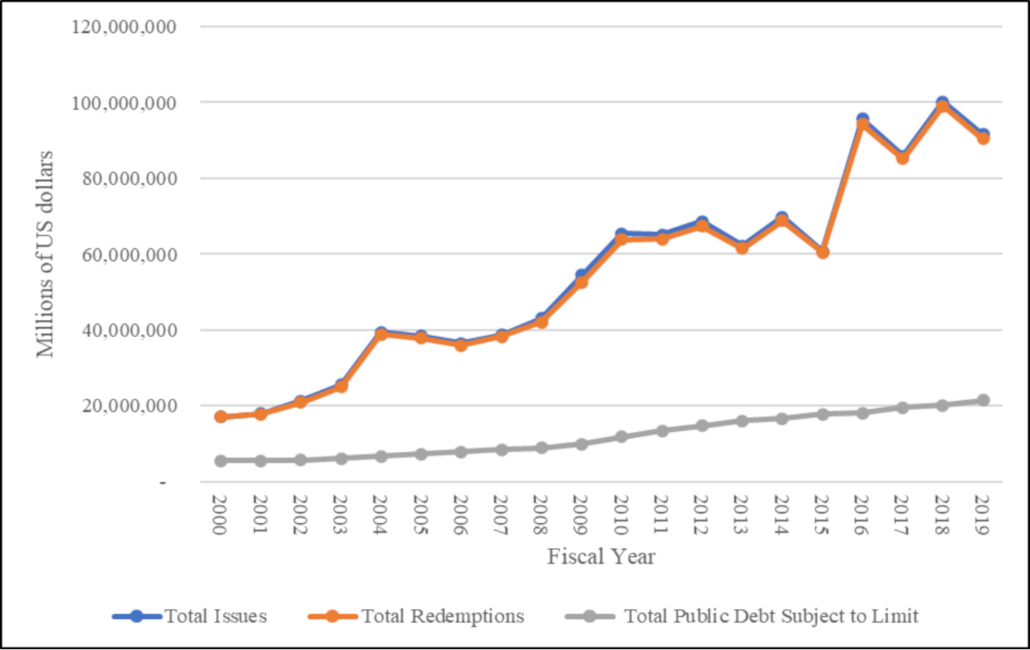
Over time, total redemptions/issuance have been growing more rapidly than total debt. Note the substantial increase in redemptions/issuance that occurred in 2016, which is concurrent with the time frame in which the Army had $6.5 trillion in unverified transactions. What could explain the growing divergence between redemptions/issuance and total debt, especially the notable increase in the divergence in 2016? Issuance/redemptions increased from about $60 trillion in 2015 to $95 trillion in 2016.
One possible explanation for the divergence is that the average term-length decreased substantially over time, thus requiring increased debt reissuance. However, data provided by Quandl show that the average term-length has been relatively stable; average term-length, about 68 months in 2000, then steadily decreased to 53 months in 2006 before trending upward to about 70 months by 2019 (Quandl, 2020). The changing trend in term-length appears to be due to the fact that Treasury stopped offering 30-year bonds in 2000 and then reintroduced them in 2006 (Treasury, 2020b). Thus, changing term-length does not explain the divergence.
Our analysis can also be used to calculate the amount of total debt that appears to be supported with the $90 trillion in redemptions and reissuance. Unless we are missing some important information about the nature of debt reissuance, $90 trillion in reissuance over the course of 2019 could support as much as $123 trillion in total federal debt.
Are we missing some critical information? If so, what is it? Could it be that the United States Treasury is servicing far more debt through debt turnover and reissuance than is officially reported? While this initial analysis suggests that further analysis is warranted, we emphasize that it is a preliminary evaluation designed to spur further inquiry.
Conclusion
In 2020, the federal response to COVID-19 has been to close down large portions of the U.S. economy. This decision is having a significant impact on federal government finances. The most recent estimate from the Congressional Budget Office indicates that deficit spending will approach $4 trillion this year (Nicholson, 2020). Further, Congress is currently proposing an additional $3 trillion spending package (Ferris and Caygle, 2020). At the same time, the Federal Reserve has provided trillions of dollars of new stimulus. The current situation shows that it is possible to issue several trillions of dollars in new Treasury debt in a single year while maintaining a low-interest-rate environment, enabled by Federal Reserve Bank guarantees to monetize as much debt as is needed and to provide broad support to both domestic and global fixed income markets and swap capacity to foreign central banks.
We point out that our comments on federal funding in this update are limited to U.S. Treasury debt. The federal government also issues significant amounts of securities, credit, and insurance in the mortgage and other markets that provide additional sources of leverage and funding (Fitts and Betts, 2019).
The current round of fiscal and monetary stimulus combined with the secrecy of federal accounts and financing raise the question as to whether our current situation reflects a financial response to a health crisis or whether COVID-19 is being used as a pretext to engage in a new round of financial bailouts, in the process instituting greater political controls and surveillance in anticipation of debasement or abrogation of existing and future benefits.
We continue to believe that getting to the bottom of the federal government’s refusal to obey its own laws related to appropriations and financial disclosure and management since fiscal year 1998, and the reversal or restoration of illegal transactions, are a more appropriate response than abrogating Constitutional rights.
References
Aftergood, S., 2020. “Pentagon Asks to Keep Future Spending a Secret.” Secrecy News, Federation of American Scientists. Available at https://fas.org/blogs/secrecy/2020/03/ndaa-fydp/.
Ferris, S., and Caygle, H., 2020. “Pelosi Moving Swiftly on $3 Trillion Relief Plan Despite Dem Gripes.” Politico. Available at https://www.politico.com/news/2020/05/14/nancy-pelosi-coronavirus-relief-plan-259502.
Fitts, C., and Betts, C., 2019. “Caveat Emptor: Why Investors Need to Do Due Diligence on U.S. Treasury and Related Securities.“ Available at https://hudmissingmoney.solari.com/caveat-emptor-why-investors-need-to-do-due-diligence-on-u-s-treasury-and-related-securities/.
Kotlikoff, L., and Skidmore, M., 2017. “Has Our Government Spent $21 Trillion of Our Money Without Telling Us?” Forbes. Available at https://www.forbes.com/sites/kotlikoff/2017/12/08/has-our-government-spent-21-trillion-of-our-money-without-telling-us/#3bdce2fd7aef.
Nicholson, J., 2020. “U.S. Budget Deficit Will Expand to Almost $4 Trillion this Year, CBO Says.” MarketWatch. Available at https://www.marketwatch.com/story/us-budget-deficit-will-expand-to-almost-4-trillion-this-year-cbo-says-2020-04-24.
Quandl, 2020. “Maturity Distribution and Average Length of Marketable Interest-Bearing Public Debt.” Available at https://www.quandl.com/data/USTREASURY/MATDIS-Maturity-Distribution-and-Average-Length-of-Marketable-Interest-Bearing-Public-Debt.
Skidmore, M., 2019. FOIA Request from Mark Skidmore to the United States Office of the Inspector General. Available at https://missingmoney.solari.com/missing-money-update-may-2020/.
Skidmore, M., and Fitts, C., 2019. “Should We Care about Secrecy in Financial Reporting?” Available at https://hudmissingmoney.solari.com/should-we-care-about-secrecy-in-financial-reporting/.
United States Department of Defense Inspector General, 2016. “Army General Fund Adjustments Not Adequately Documented or Supported.” Available at https://media.defense.gov/2016/Jul/26/2001714261/-1/-1/1/DODIG-2016-113.pdf.
United States Department of the Treasury, 2019. “Daily Treasury Yield Curve Rates.” Available at https://www.treasury.gov/resource-center/data-chart-center/interest-rates/Pages/TextView.aspx?data=yieldYear&year=2019.
United States Department of Treasury, 2020a. “Monthly Statement of Public Debt (September 2019).” Available at https://www.treasurydirect.gov/govt/reports/pd/mspd/2020/2020_jan.htm.
United States Department of the Treasury, 2020b. “History of Marketable Securities Products and Programs.” Available at https://www.treasurydirect.gov/indiv/research/history/histtime/histtime_bonds.htm.
United States Office of the Inspector General, 2020. Document obtained from a Freedom of Information Act Request. Available at https://missingmoney.solari.com/missing-money-update-may-2020/.
United States Social Security Administration, 2019. “SSA’s FY 2019 Agency Financial Report.” Available at https://www.ssa.gov/finance/2019/Financial%20Statements.pdf.
1
We thank Mr. Tom Stanis for bringing the question about federal government debt redemption and reissuance to our attention. We also thank Ms. Camila Alvayay-Torrejon and Rob Kirby for capable research assistance.
* Department of Agricultural, Food, and Resource Economics/Department of Economics, Michigan State University, 91 Morrill Hall of Agriculture, East Lansing, MI 48824-1039; mskidmor@msu.edu; 517-353-9172.
** Solari, Inc., P.O. Box 157, Hickory Valley, TN 38042; catherine@solari.com.
2
See the Daily Treasury Statement for September 30, 2019 (the last day of the fiscal year) for a summary: https://fsapps.fiscal.treasury.gov/dts/issues/2019/4?sortOrder=desc#FY2019Q4.
3
See the Monthly Statement of Public Debt (Treasury, 2020a): https://www.treasurydirect.gov/govt/reports/pd/mspd/2020/2020_jan.htm